CPU at 100%: How to Find and Fix the Cause
Learn why CPU at 100% happens, which counters show a real problem, how to find the process behind it, and how to fix the cause safely.
Your laptop's fan is racing, a browser tab won't respond, and Task Manager shows the CPU at 100%. It's tempting to end the biggest process immediately, especially if its name looks unfamiliar. Before you do, capture what's happening. That busy process might be doing legitimate work, exposing a cooling problem, or waiting on a troublesome driver.
A full CPU reading is a symptom to trace, not a malware verdict. The safest route is to identify the workload, check whether the processor is delivering useful performance, and change only what the evidence supports.
Check Whether 100% CPU Is Really a Problem
100% CPU means the processor had no idle time during the measurement interval. It doesn't tell you whether the work was useful, whether the chip was running at its expected speed, or whether anything is broken.
For example, Microsoft's CPU utilization explanation describes a processor rated at 2.0 GHz running temporarily at 500 MHz: using all 500 million available cycles can still produce a 100% utilization reading. That's why utilization and clock speed belong together when diagnosing poor performance.
A short burst during an application launch, compilation, update, media export, or security scan can be ordinary. More important than the peak is whether the activity finishes, whether the computer remains usable, and whether performance returns to normal afterward.
Read the counters in context
These Windows processor-counter reference ranges help distinguish application work from system-level activity. Treat them as investigation guides, not universal pass-or-fail limits for every workload.
Processor counter thresholds for Windows
| Counter | Healthy | Warning | Critical |
|---|---|---|---|
| % User Time | Below 50% | 50-80% | Above 80% |
| % Privileged Time | Below 30% | 30-50% | Above 50% |
| % Idle Time | Above 20% | 10-20% | Below 10% |
High user time generally directs attention toward applications and services. High privileged time directs attention toward kernel work, drivers, and hardware interrupts. Neither counter identifies the culprit by itself.
On multicore machines, check how your tool reports usage. The operating system's overall percentage generally combines activity across cores, while some process tools can report a fully occupied core as a full processor's worth of activity and show higher values when several cores are busy.
Practical rule: Judge utilization alongside responsiveness and completed work. A busy processor that finishes an export is different from a busy processor that makes no progress.
High utilization can be intentional. The ACM-published DCPerf study reported peak CPU utilization of 90-100% for MediaWiki and 95-100% for video-transcoding workloads in 2025. Those are benchmark workloads, not expectations for an idle home computer.
Before changing anything, answer three questions: How long does the reading last? Does the computer feel slow? Which process is responsible?
How to Find the Process Behind the Load
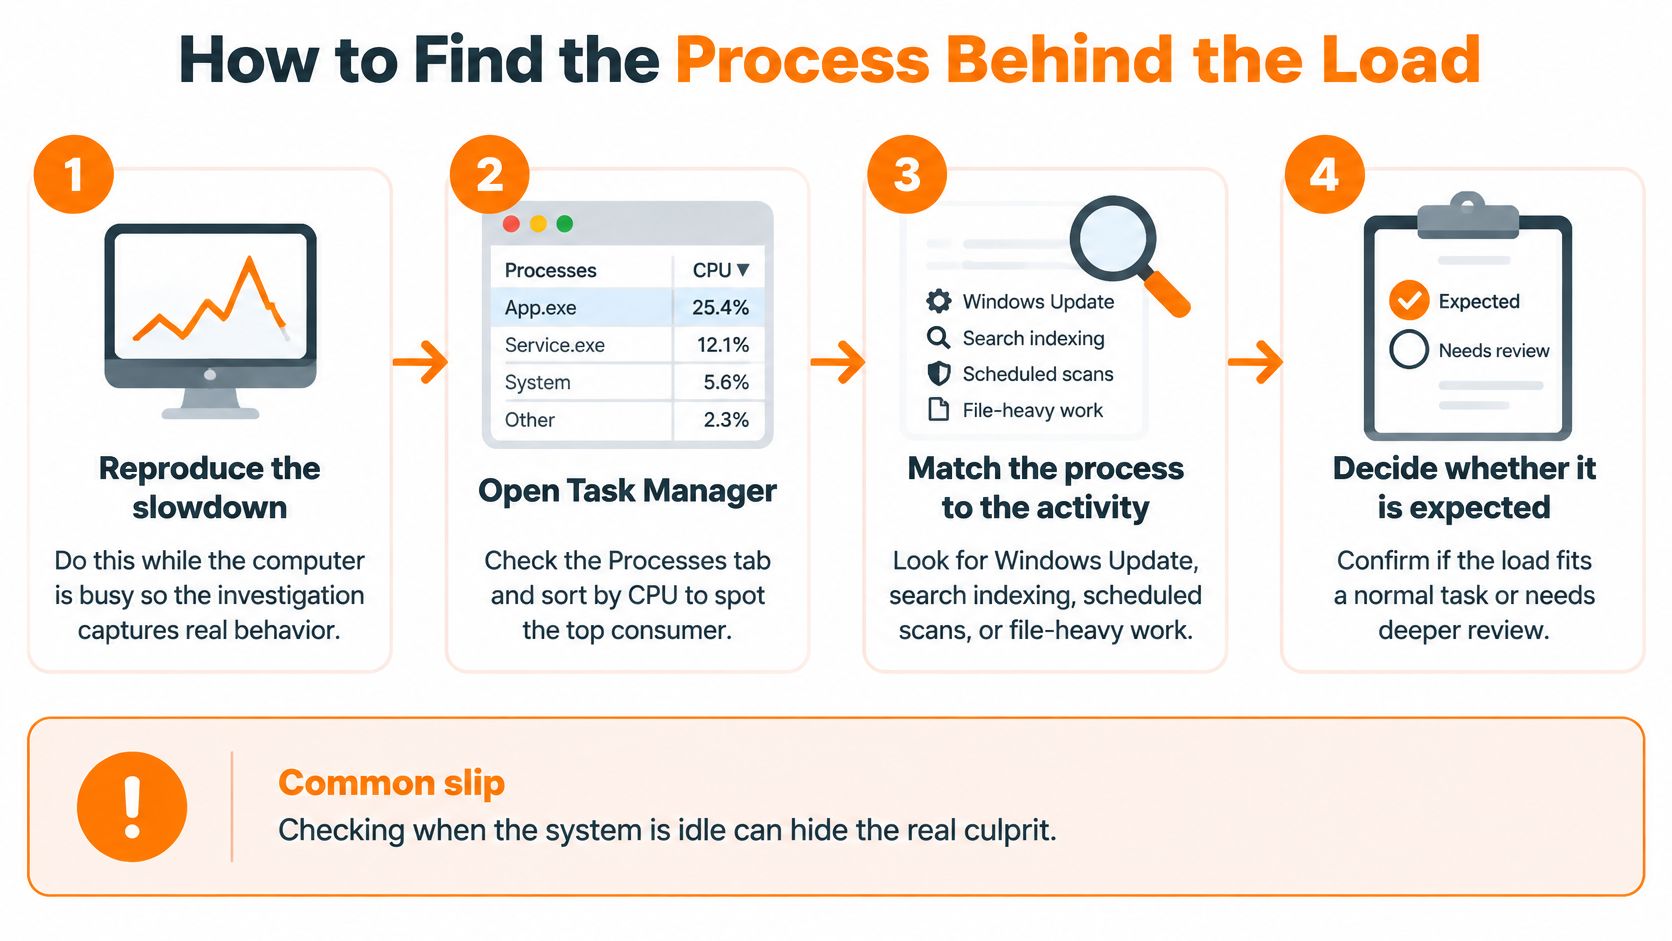
Start while the slowdown is happening. Opening a monitoring tool after everything has recovered may show a perfectly healthy computer and tell you little about the interruption.
Use this visual flow for the initial check, then capture more detail if the cause remains unclear.
Capture the active slowdown
Reproduce the activity that causes the problem. Open the same application or repeat the same operation, provided it's safe. The common slip is testing an unrelated workload and assuming the result explains the original slowdown.
Open Resource Monitor. Type
resmoninto Start search, open it, and select the CPU tab. Task Manager is useful for a quick view, but don't stop at its large total-usage number.Sort Processes by Average CPU. Click the column heading so the busiest processes appear first. This helps separate sustained consumption from a process that briefly jumped to the top.
Record the process name and PID. For
svchost.exe, select the process and inspect the associated services in the Services pane. Don't treat every service host as interchangeable, because different instances can host different services.
Save a screenshot or write down the process, what you were doing, and whether the application was making progress. A useful result is a named process that becomes busy during the slowdown but settles during normal use.
Log intermittent problems
For problems that disappear before you can inspect them, Microsoft's Performance Monitor troubleshooting guidance recommends investigating CPU conditions lasting more than one minute, provides the processor-counter ranges above, and describes logging at 1-5-second intervals with a Windows Performance Recorder capture of 3-5 minutes.
Create a Performance Monitor log. Open
perfmon, expand Data Collector Sets, and create a user-defined set with processor counters, including user, privileged, and idle time. Start it before reproducing the issue, then stop it afterward so the timeline stays relevant.Use Windows Performance Recorder when the counters aren't enough. If it's available, capture CPU activity around the problem and save the trace for analysis. Avoid recording an entire work session, since traces can grow quickly and contain unrelated activity.
On macOS, open Activity Monitor, select CPU, and sort by % CPU. On Linux, use top or htop to identify busy processes; don't read load average as a CPU percentage, because it represents demand and can include tasks waiting on input/output.
Telling Them Apart
High CPU doesn't automatically mean malware. A scheduled antivirus scan can make a computer busy while doing exactly what you installed it to do.
Keep that possibility in mind when an unfamiliar background process appears.
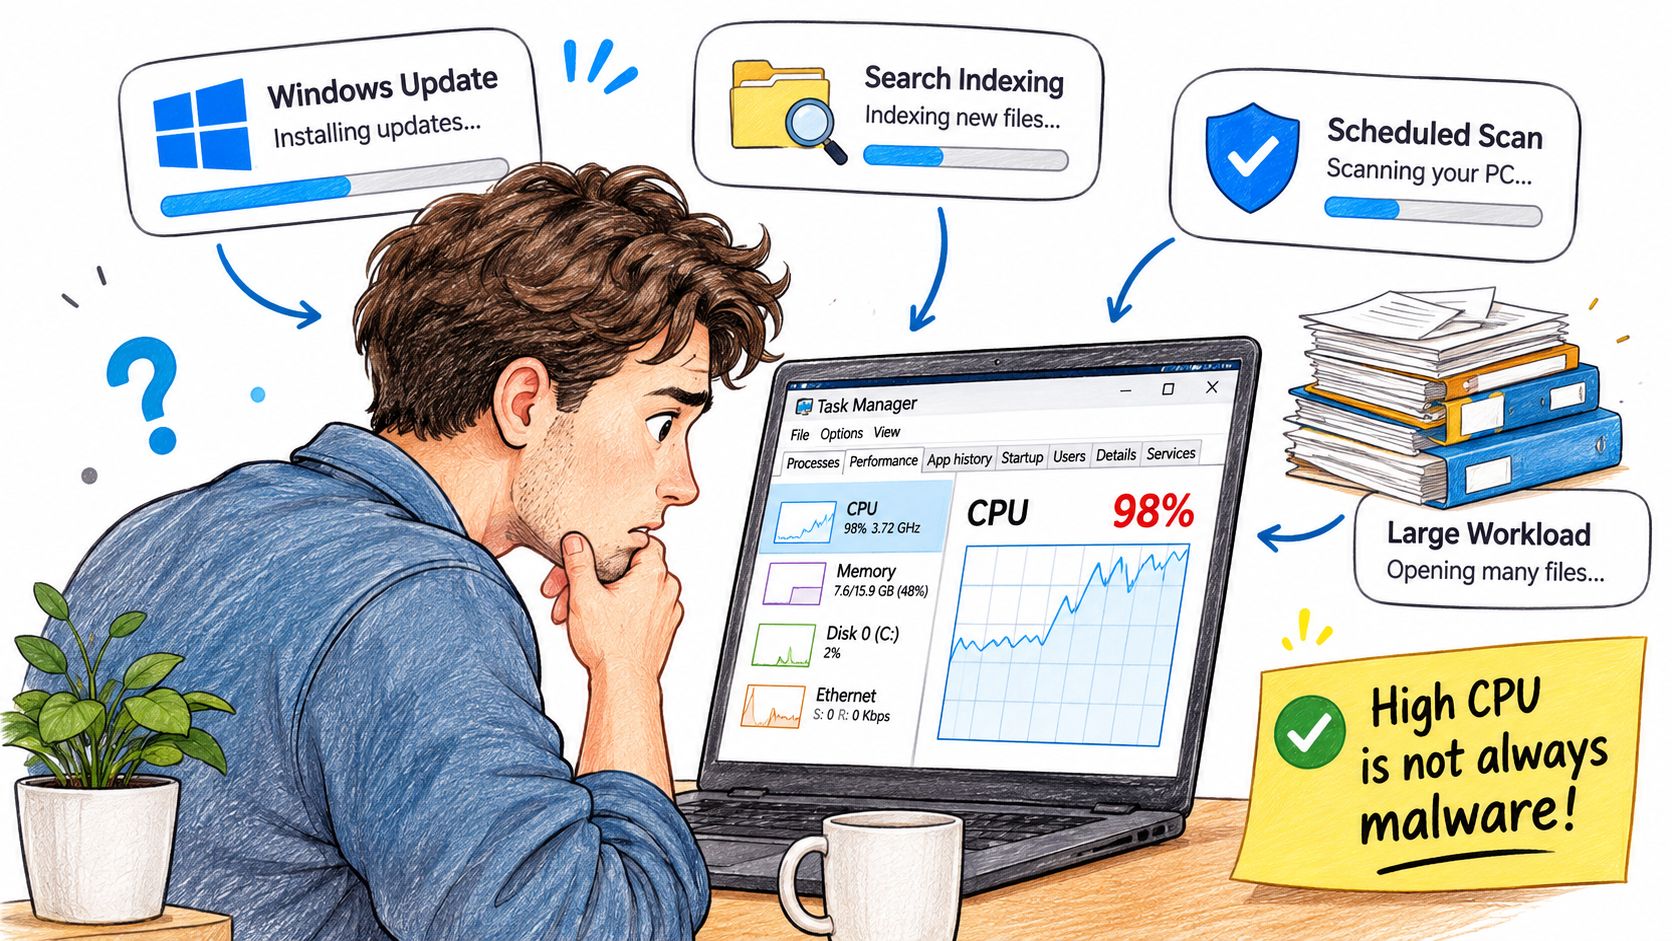
Microsoft community guidance on high CPU usage identifies malware as one possible cause alongside software, storage problems, and system activity; sustained 90-100% utilization while idle warrants investigation, not an automatic infection diagnosis.
Consider a computer that starts installing updates while a scheduled security scan examines newly downloaded files. Both activities have legitimate reasons to consume processor time. Search indexing after a large file change, backups, photo imports, and browser tabs playing video can also account for visible activity.
Match the process to its purpose
Check the relevant application's status screen. Windows Update may show an installation in progress; your antivirus may show a scan; a backup application may show files being processed. A process name alone isn't enough, so inspect its file location and publisher rather than trusting a familiar-looking label.
Security software deserves particular care. Duplicate real-time scanning can add work, but switching off protection indiscriminately trades a performance symptom for security exposure. Check which product is providing active protection and review its supported configuration before changing it.
Don't delete an unfamiliar executable just because it's busy. Establish what launched it and what it's doing first.
Use a controlled response:
- Record the timing: Note the responsible process and the activity immediately before the spike.
- Check scheduled work: Compare the event with scans, updates, indexing, and backups.
- Apply updates: Update Windows and the affected application through their normal update mechanisms.
- Investigate unexplained activity: Run a reputable on-demand scan without installing competing real-time protection.
- Escalate persistent uncertainty: Keep the findings for diagnostic analysis rather than trying aggressive cleanup utilities.
For a visual companion to the process checks, use the video below.
A clean scan doesn't explain every slowdown, and a spike during a scan doesn't invalidate the scanner. Evidence-based attribution is safer than indiscriminate removal.
Heat, Throttling and Hidden Bottlenecks
Thermal throttling protects the processor by reducing power and clock speed when it reaches a thermal limit. The computer can remain heavily utilized while completing less work.
A loud fan, hot chassis, and stalled applications are reasons to check cooling, but they aren't temperature measurements. Use your computer manufacturer's monitoring utility or a compatible hardware monitor to log utilization, per-core frequency, package temperature, and thermal-throttle indicators during a repeatable workload.
Check cooling before stopping the workload
Compare the observed frequency with the processor's expected sustained operating range, accounting for its power mode. Don't use advertised maximum boost speed as a requirement for every core under continuous load.
- Clear the air path: Shut down and unplug the computer before cleaning accessible intake vents and filters.
- Verify fan operation: Check that the fan operates under load without touching moving components.
- Inspect cooler contact: Check cooler seating only if you're comfortable servicing the machine; otherwise, arrange a physical inspection.
- Retest consistently: Repeat the same workload under the same power conditions.
Ending the busy process before recording temperature and frequency can conceal a cooling fault. Don't prolong testing if the machine is shutting down or showing signs of unsafe heat.
Microsoft's high-CPU troubleshooting guidance also recommends checking queue length, context switches, and interrupts when total utilization doesn't explain the slowdown.
Secondary counters and what high values point to
| Signal | What It Usually Indicates | Where to Look Next |
|---|---|---|
| Clock speed well below expected speed under load | Thermal or power throttling | Vents, fan, cooler seating, power plan |
| Processor Queue Length sustained high | Work waiting for a free CPU | Startup apps and background services |
| Context switches per second very high | Competing threads or possible driver churn | Process list and recent updates |
| Processor interrupts per second high | Driver or hardware interrupt load | Device Manager and network or storage drivers |
| Package temperature near limit with falling frequency | Possible cooling fault | Intake filters, fan operation, cooler contact |
These are directions for investigation, not diagnoses. Compare counters with normal operation on the same computer; temperature and frequency problems that persist after a clean restart warrant hardware-focused attention.
Fix the Cause Behind Each Symptom
Use the observed symptom to choose a first action. The likely causes below are working hypotheses, not permission to delete files or disable system components.
Sustained CPU symptoms, likely causes and fixes
| Symptom | Likely Cause | First Fix |
|---|---|---|
| One application stays fully busy | Runaway process or stuck update | Save work, update or reinstall the app, then end the task only if needed |
| Service host or System stays busy with high privileged time | Driver or interrupt load | Update or roll back the relevant driver and check Device Manager for errors |
| High CPU persists after boot | Startup apps, indexing or updates | Let legitimate indexing finish, then trim unnecessary startup apps |
| Loud fan, slow apps and low clock speed | Thermal throttling | Clean intake vents, confirm fan operation, check cooler seating |
| Heavy idle activity from an unknown process | Possible malware or storage trouble | Run an on-demand scan, then check disk health |
| Spike returns after each attempted fix | Unresolved software issue or deeper system fault | Keep the logs and escalate |
Choose a fix you can verify
For a runaway application, save your work before ending it. Repeated force-quits may restore responsiveness without correcting the underlying fault. Check for an application update, test whether a particular file triggers the problem, and consider reinstalling only after protecting settings and local data.
A busy service host doesn't automatically justify stopping services. If privileged time or interrupts are prominent, inspect Device Manager for warnings and review recent network, storage, graphics, or peripheral driver changes. Use the computer or component manufacturer's driver package rather than a bulk driver-updater utility.
Change one thing, repeat the original workload, and compare the result. Several simultaneous changes make a successful fix difficult to identify and an unsuccessful one harder to undo.
Post-boot activity needs context. Check whether Windows Update or indexing is progressing before disabling startup items. In Task Manager > Startup apps, disable optional applications you recognize, not security components or unfamiliar entries selected at random.
For unknown idle activity, follow a deliberate malware investigation and removal workflow rather than running a registry cleaner. If security checks don't explain the behavior, review storage health with the drive manufacturer's diagnostic tool and protect important files before intrusive testing.
When a fix fails, repeat the original reproduction and process capture. Keep the unsuccessful change in your notes, undo it where appropriate, and use the new evidence to narrow the diagnosis instead of cycling through unrelated tweaks.
Confirm the Next Step Before You Escalate
Keep troubleshooting yourself while you can identify the process, connect it to a repeatable trigger, and make a reversible software change. Escalate when the slowdown returns after the suspected cause is removed, unknown activity persists after a reputable scan, or temperature and frequency readings suggest a physical problem.
Don't buy replacement hardware based solely on a utilization percentage. A technician needs evidence that separates workload demand from reduced performance, driver activity, and application faults.
Prepare a useful handoff
Bring the information that lets someone reproduce and investigate the issue:
- Process identity: The executable name, PID, and associated service where relevant.
- Trigger and timing: What you opened, connected, downloaded, or changed before the slowdown.
- Performance evidence: The Performance Monitor log or Windows Performance Recorder trace, plus relevant screenshots.
- Thermal observations: Temperature, frequency, throttle indicators, and the workload used for testing.
- Changes already tried: Application updates, driver changes, scan results, and whether each attempt changed the behavior.
Share diagnostic files through the agreed support channel. Logs and traces can contain application names, file paths, and other information you wouldn't want to post publicly.
At 247TechTeam, our Quick Fix Session costs $49.00 and includes one remote support session of up to 60 minutes for one Windows or Mac computer, with a session summary sent by email. Sessions are subject to the stated limits; we don't offer unlimited support.
If an issue falls outside a remote session's scope, such as hardware failure or physical damage, our technician says so and points you toward the appropriate next step. Remote diagnosis can help distinguish a software problem from something requiring physical inspection, but it can't reseat a cooler or replace a failing component.
Before acting, confirm the process, confirm the trigger, and decide whether the evidence points toward software or hardware. That gives you a defensible next step instead of another guess.
247TechTeam offers remote troubleshooting for slow Windows and Mac computers, along with antivirus protection and malware assistance. If your CPU stays busy and you can't explain why, visit 247TechTeam to review the available support options, and bring your process notes and logs so the investigation starts with evidence.